
16 Important Sales Enablement KPIs You Must Measure in 2026
Track the sales enablement KPIs that matter most in 2026, from win rate and quota attainment to automation rate and RFP response efficiency.

Ops Lead, AutoRFP.ai··18 min read
Sales enablement KPIs help answer one important question: are your enablement efforts actually helping sellers perform better?
From content usage and training completion to win rates, sales cycle length, and quota attainment, the right metrics show whether your strategy is creating measurable business impact.
In this guide, we’ll cover why tracking sales enablement KPIs matters, the key KPIs to measure, how to track and analyze them, and real examples of how teams improve enablement performance.
The Importance of Tracking Sales Enablement KPIs
Sales enablement KPIs show whether your content, training, tools and coaching are actually improving sales performance, or just adding more activity to an already crowded workflow.
That matters because reps are already stretched. Salesforce reports that sales reps spend more than half their time on non-selling work, including data entry and prospecting.
If enablement does not track productivity, content usage, ramp time and time-to-revenue, teams cannot see whether they are helping reps sell or simply giving them more to manage.
Tracking KPIs also matters because buyers expect stronger business justification. Salesforce found that 69% of sales professionals say measurable ROI is more important to customers than it was last year, while 67% say customers require more education before buying.
That means enablement cannot stop at product decks and training attendance. It has to help reps prove value, explain ROI and move buyers through more complex decision processes.
Sales enablement KPIs help teams understand:
Which content supports real deals: Track which decks, case studies, one-pagers and ROI materials are actually used in active opportunities.
Whether training changes rep behavior: Attendance is not enough. KPIs should show whether reps apply the training in calls, demos, follow-ups and objection handling.
How fast reps become productive: Ramp time and time-to-first-deal show whether onboarding is helping new hires reach revenue contribution faster.
Where reps get stuck: KPIs can reveal gaps in product knowledge, competitor positioning, deal progression, CRM discipline or buyer education.
How enablement affects revenue: Win rate, sales cycle length, quota attainment and pipeline conversion connect enablement work to commercial outcomes.
The mistake is collecting more data and calling it a strategy.
Many teams already have dashboards, but that does not mean they are making better decisions.
Gartner found that 84% of sales leaders say sales analytics has had less influence on sales performance than leadership expected, with poor data quality and limited cross-functional collaboration among the top barriers.
That is why KPI selection matters.
Strong sales enablement teams do not track every possible metric. They track the numbers that show whether enablement is improving rep execution, buyer conversations and revenue outcomes.
The real goal is simple: prove that enablement is helping sales teams sell better, not just stay busier.
Difference Between Sales Enablement Metrics and KPIs
Here are the differences:
| Area | Sales enablement metrics | Sales enablement KPIs |
|---|---|---|
| Meaning | Metrics track activity, usage, volume or performance signals. | KPIs track the most important outcomes tied to sales and revenue goals. |
| Purpose | They help teams understand what reps are doing and where activity is happening. | They help teams decide whether enablement is actually improving performance. |
| Focus | Adoption, completion, usage, productivity and output. | Revenue impact, sales effectiveness, conversion and deal quality. |
| Examples | Training completion rate, content usage, CRM activity, proposal turnaround time, number of RFPs submitted, number of RFPs completed, and average time spent on RFP responses. | Quota attainment, sales cycle length, win rate, ramp time, pipeline conversion, RFP win rate, shortlist rate, and revenue influenced by enablement. |
| Decision value | Useful for spotting gaps, bottlenecks and adoption issues. | Useful for proving impact, prioritizing investment and showing what actually drives revenue. |
| Risk if tracked alone | Metrics can make a team look busy without proving business value. | KPIs can show the outcome, but without metrics, teams may not know what caused the result. |
The practical difference is simple: a metric tells you something happened. A KPI tells you whether it mattered.
For example, submitting more RFPs, completing more training or increasing content usage may look positive. But those numbers only matter if they improve outcomes such as RFP win rate, quota attainment, deal velocity or revenue contribution.
16 Most Important Sales Enablement KPIs to Track
These are the crucial sales enablement KPIs you need to track to understand whether your content, training, tools, automation, and rep support are actually improving pipeline, productivity, and revenue outcomes:
| KPI name | KPI category | What it measures | Why it matters (business impact) |
|---|---|---|---|
| Win rate / conversion rate | Pipeline | Whether opportunities convert into closed-won deals | Shows whether enablement improves sales execution and deal outcomes |
| Revenue generated / revenue influenced | Pipeline | Revenue directly or indirectly supported by enablement | Connects enablement work to measurable business impact |
| Quota attainment | Pipeline | How many reps meet or exceed sales targets | Shows whether enablement helps reps perform consistently |
| Sales cycle length | Efficiency | How long it takes to move a deal from opportunity to close | Shows whether reps can reduce friction and move buyers faster |
| Average deal size | Pipeline | Whether reps are closing higher-value deals | Shows whether enablement supports value selling and expansion |
| Opportunities created / meetings set | Pipeline | Whether reps generate qualified sales activity | Shows whether enablement improves pipeline creation |
| Rep productivity | Efficiency | How efficiently reps turn effort into pipeline or revenue | Shows whether reps are spending effort on the right selling activities |
| Time spent selling | Efficiency | How much time reps spend selling instead of doing admin | Shows whether enablement removes manual work from the sales process |
| Time to productivity / time to first sale | Onboarding | How quickly new reps become productive | Shows whether onboarding prepares reps for real selling situations |
| Content usage and influence | Adoption | Whether sales content is used and helps move deals forward | Shows which assets support buyer conversations and pipeline progression |
| Buyer content adoption | Adoption | Whether buyers engage with sales content | Shows whether content is useful to the buyer, not just the seller |
| Tool adoption | Adoption | Whether reps use CRM, enablement platforms, AI tools, or content hubs | Shows whether the sales tech stack is actually being used |
| Training retention | Onboarding | Whether reps remember and apply training | Shows whether training changes behavior after the session ends |
| Rep / user satisfaction | Adoption | How useful reps find enablement content, tools, and proc | |
| Enablement cost per outcome | Efficiency | The cost of enablement compared with revenue, time saved, win-rate lift, or productivity gains | Shows whether enablement spend is producing measurable business value |
| Automation rate | Efficiency | How much repeatable sales, proposal, content, or admin work is handled through automation | Shows whether automation is reducing manual work and increasing team capacity |
1. Win Rate/Conversion Rate
Win rate measures whether enablement helps reps convert more opportunities into closed-won deals.
Track:
Overall win rate: The percentage of qualified opportunities that become customers.
Win rate by segment: Performance across SMB, mid-market, enterprise, region, or product line.
Conversion rate by stage: How well reps move buyers from discovery to demo, proposal, negotiation, and close.
Content-assisted win rate: Whether deals that use specific content, battlecards, or proof points close more often.
RFP win rate: The percentage of submitted RFPs that turn into wins.
For RFP-heavy teams, do not only track the number of RFPs submitted. Track RFP win rate, shortlist rate, and completed-on-time rate using AI-native RFP tool like AutoRFP.ai so you can see whether enablement is improving response quality, not just response volume.
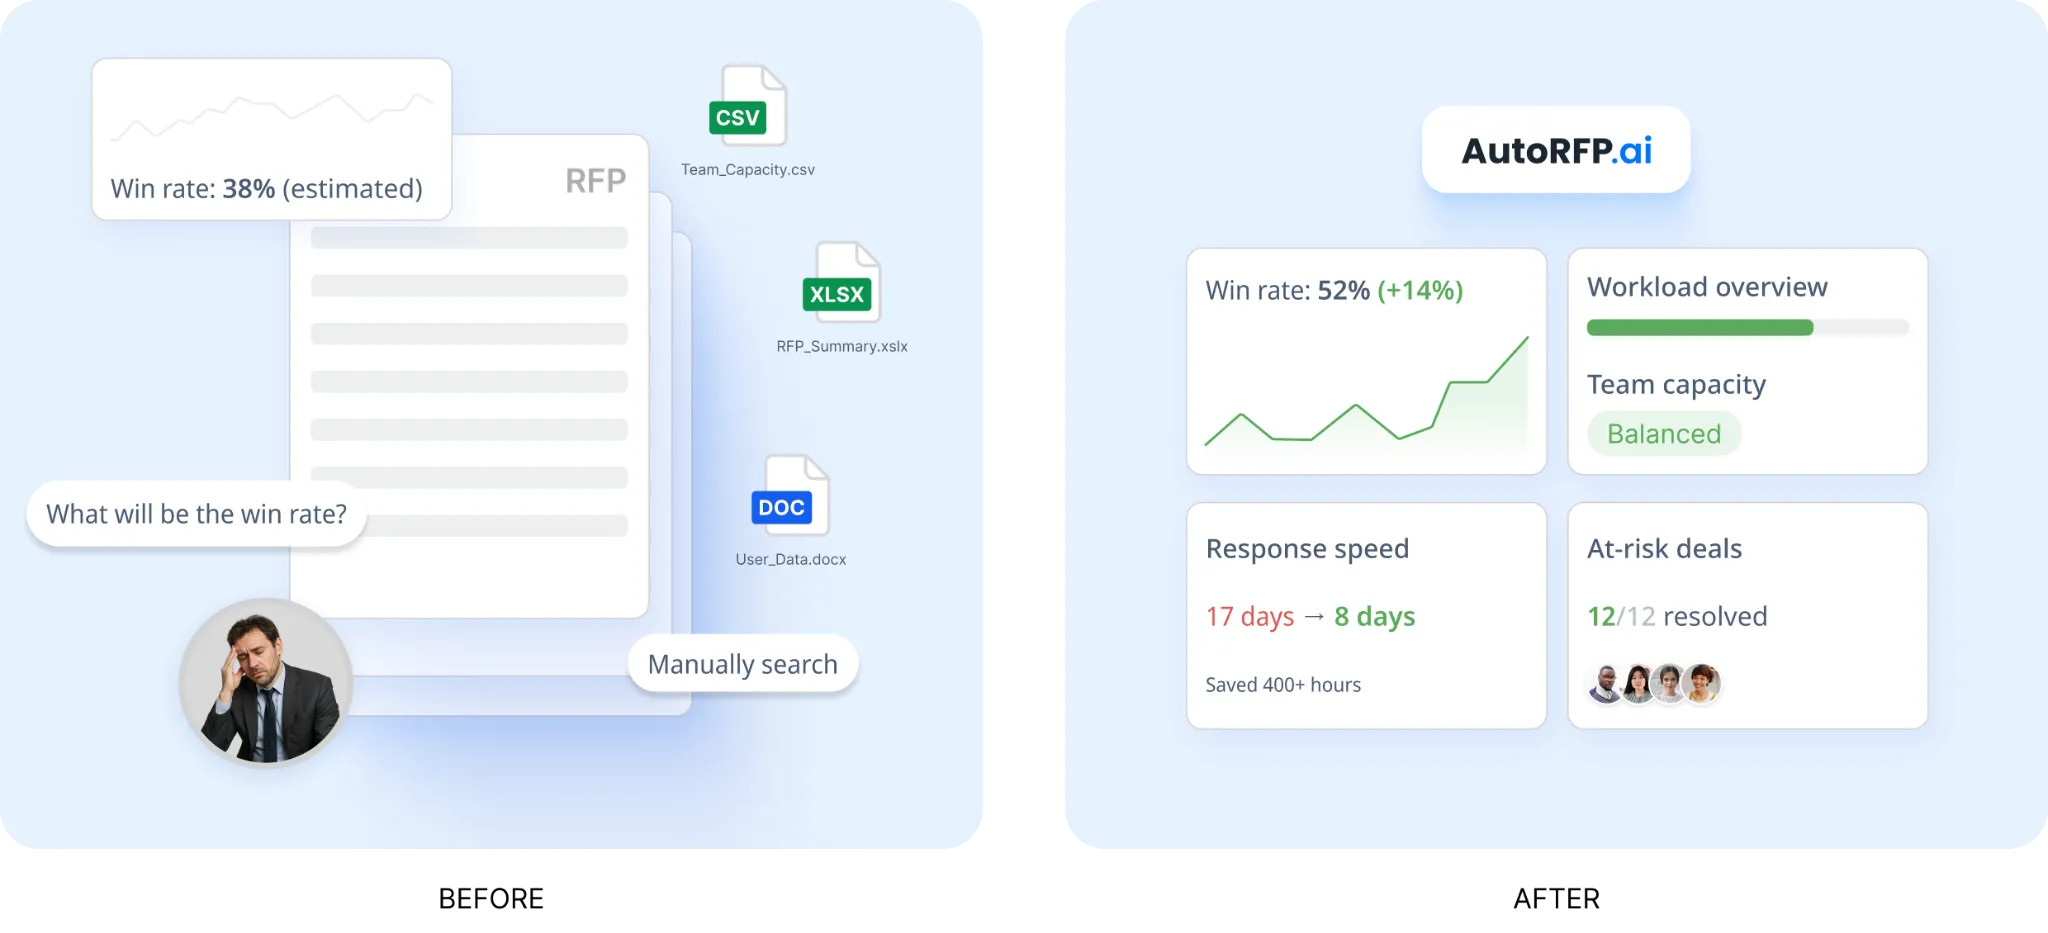
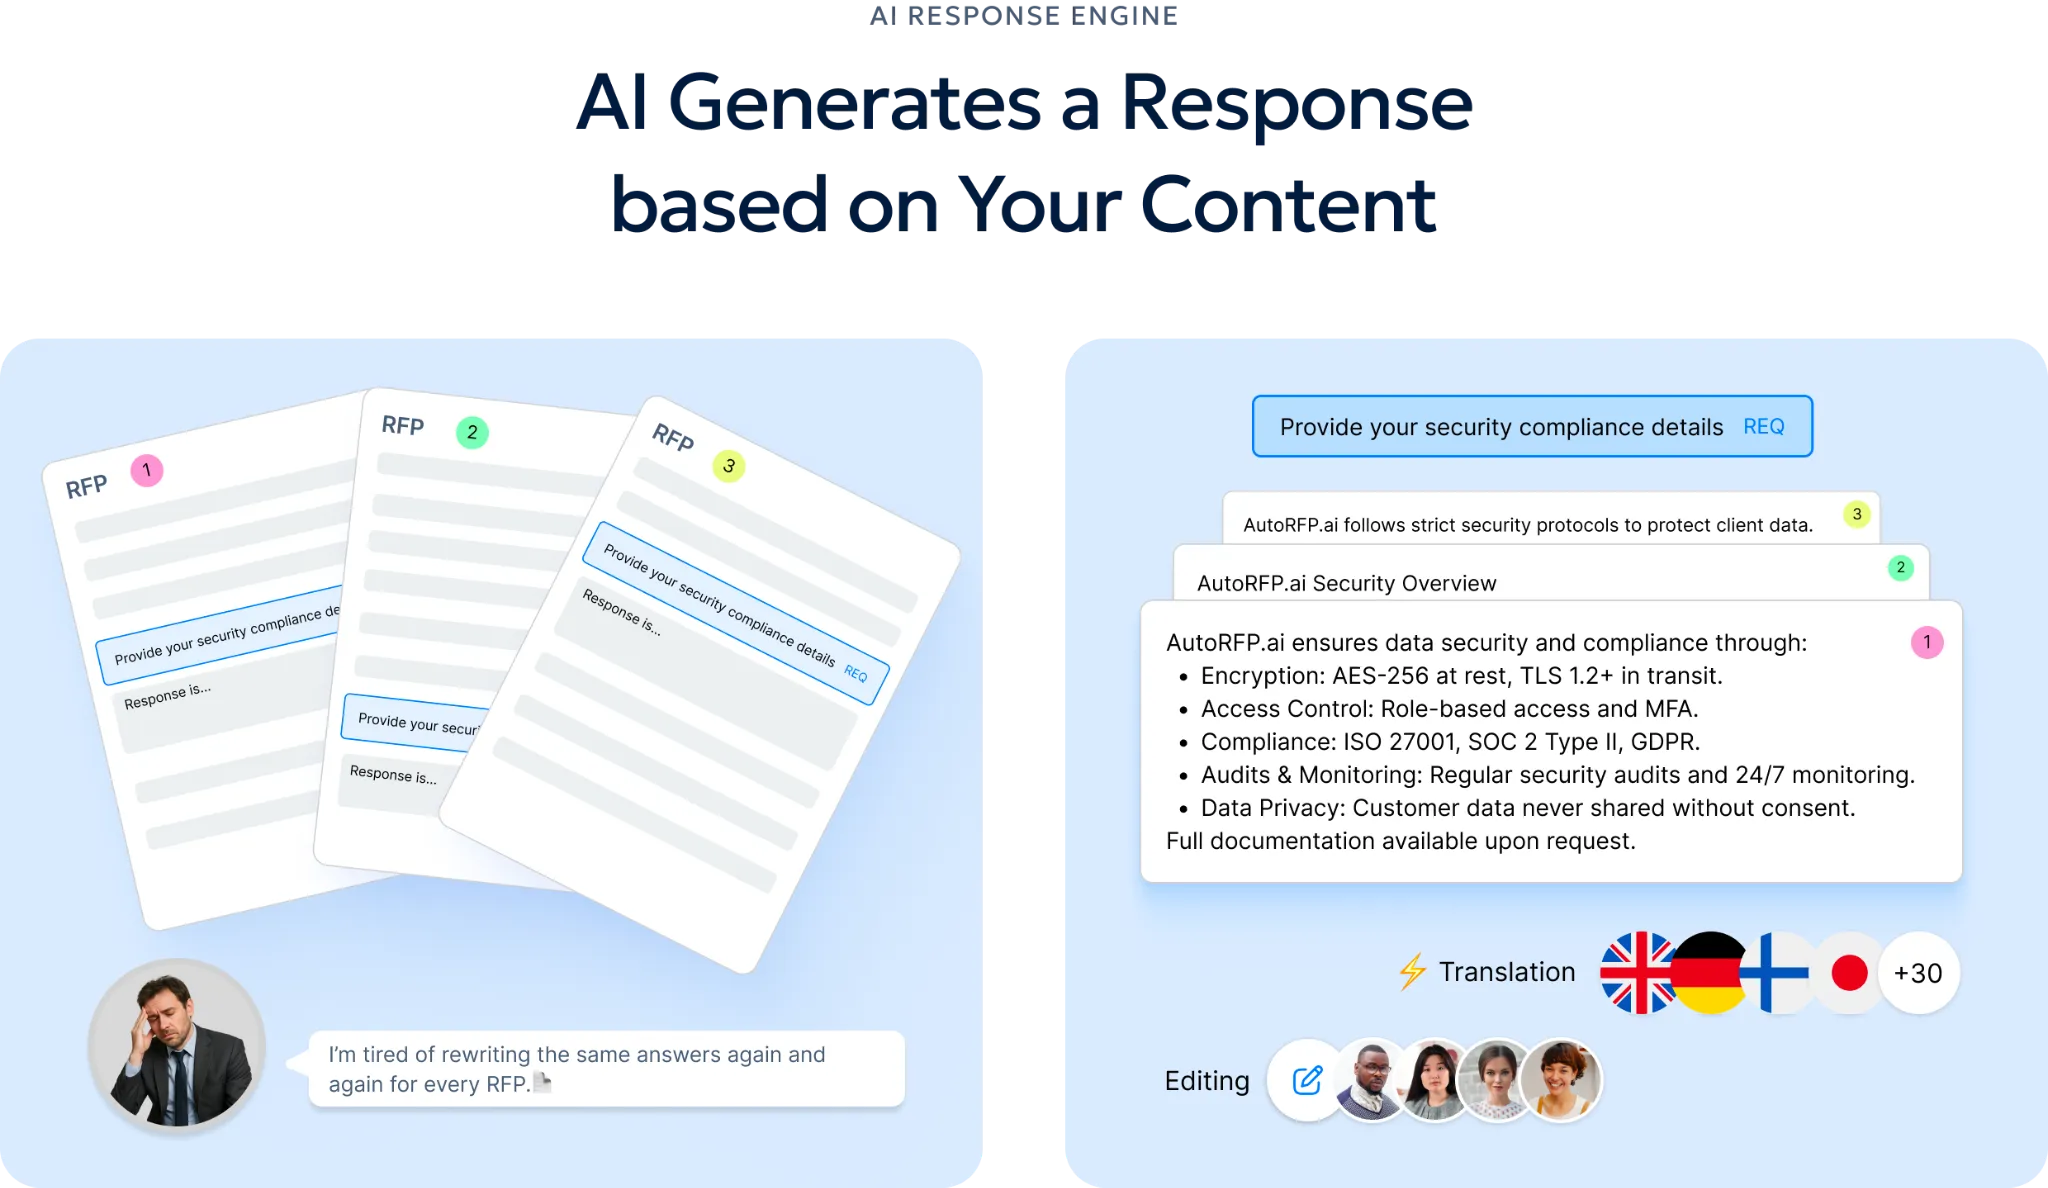
AutoRFP.ai creates source-backed first drafts, scoring every answer for trust, and linking responses back to approved sources. That gives bid teams more time to improve positioning instead of chasing old answers.
2. Revenue Generated/Revenue Influenced
Revenue generated shows the revenue directly tied to enablement-supported activities. Revenue influenced shows where enablement helped move a deal forward.
Track:
Generated revenue: Closed-won revenue directly connected to enablement programs or campaigns.
Influenced revenue: Revenue from deals where reps used enablement content, training, or tools.
Pipeline influenced: Open pipeline supported by enablement assets or workflows.
Revenue by program: Revenue connected to onboarding, product training, competitive enablement, or proposal support.
Revenue by asset: Deals influenced by case studies, ROI calculators, security answers, or RFP content.
Pro tip: Define what “influenced” means before reporting it. A content view, a training completion, and an AI-assisted proposal response should not all carry the same weight.
3. Quota Attainment
Quota attainment shows how many reps meet or exceed their sales targets.
Track:
Percentage of reps at quota: How many reps hit their assigned target.
Quota attainment by tenure: Whether new reps, ramping reps, and experienced reps are performing differently.
Quota attainment by team: Performance across regions, managers, or segments.
Middle performer movement: Whether enablement helps average reps improve, not just top performers.
Quota gap: How far underperforming reps are from target.
4. Sales Cycle Length
Sales cycle length measures how long it takes to move a deal from opportunity creation to close.
Track:
Average sales cycle: The average number of days from qualified opportunity to closed-won.
Stage duration: How long deals sit in discovery, demo, proposal, negotiation, or procurement.
Cycle length by deal size: Whether larger deals are moving slower than expected.
Cycle length by segment: Whether enterprise, mid-market, or SMB deals need different enablement support.
Delay sources: Where deals slow down because of pricing, security, legal, RFPs, or missing buyer education.
5. Average Deal Size
Average deal size measures whether enablement helps reps sell higher-value deals.
Track:
Average Contract Value: The average value of closed-won deals.
Deal Size by Segment: How deal value changes across buyer groups.
Expansion Value: Upsell, cross-sell, or add-on revenue influenced by enablement.
Discounting Trends: Whether better value messaging reduces unnecessary discounting.
Multi-Product Deals: Whether reps are selling broader solutions instead of single products.
Strong enablement helps reps move beyond feature selling. It gives them the business case, ROI proof, customer stories, and objection handling needed to sell value.
6. Opportunities Created / Meetings Set
This KPI measures whether enablement supports qualified pipeline generation.
Track:
Qualified opportunities created: New opportunities accepted by sales.
Meetings set: Discovery calls, demos, or qualified conversations booked.
Outbound conversion: How many outreach attempts turn into meetings.
Campaign-supported pipeline: Pipeline created through enabled messaging or content.
Source quality: Whether opportunities from enabled plays convert into real pipeline.
Side note: Enablement helps this KPI when reps have stronger messaging, sharper talk tracks, and faster access to relevant proof.
7. Rep Productivity
Rep productivity measures how efficiently reps turn effort into meetings, opportunities, pipeline, or revenue.
Track:
Pipeline per rep: Pipeline created by each rep over a period.
Revenue per rep: Closed-won revenue per rep.
Meetings per rep: Qualified meetings generated.
Opportunities per rep: Qualified opportunities created or progressed.
Output per hour: Revenue or pipeline created relative to time spent.
This KPI is not about pushing reps to do more busywork. It is about seeing whether enablement removes friction and helps reps turn effort into outcomes.
Pro tip: Pair productivity data with time-spent-selling data. A rep may look productive because they work longer hours, not because the sales process is healthy.
8. Time Spent Selling
Time spent selling shows how much of a rep’s week is spent in actual selling activity.
Track:
Customer-facing time: Calls, demos, meetings, negotiations, and follow-ups.
Admin time: CRM updates, internal reporting, manual data entry, and coordination.
Content search time: Time spent looking for decks, answers, case studies, or proof points.
SME waiting time: Delays caused by waiting for internal experts.
Proposal or RFP time: Hours spent drafting, reviewing, and formatting responses.
9. Time to Productivity/Time to First Sale
Time to productivity measures how quickly new reps become ready to sell. Time to first sale measures how quickly they close their first deal.
Track:
Ramp time: Time from start date to full productivity.
Time to first meeting: How quickly a new rep books a qualified buyer conversation.
Time to first opportunity: How quickly a new rep creates a qualified pipeline.
Time to first sale: How quickly a new rep closes their first deal.
Ramp cohort performance: How different onboarding groups perform over time.
Important: Good onboarding should not just explain the product. It should teach reps how to run discovery, handle objections, use content, answer buyer questions, and move deals forward.
10. Content Usage and Influence
Content usage shows whether reps are using enablement assets. Content influence shows whether those assets help move deals forward.
Track:
Asset usage: How often reps use decks, one-pagers, case studies, battlecards, or ROI tools.
Usage by sales stage: Which content supports discovery, demo, proposal, procurement, or renewal.
Content-to-deal influence: Whether content usage correlates with deal progression or wins.
Unused content: Assets that were created but rarely used.
High-impact content: Assets tied to stronger conversion, faster cycles, or larger deals.
The goal is not to create more content. The goal is to identify which content actually helps reps and buyers make progress.
11. Buyer Content Adoption
Buyer content adoption measures whether buyers engage with the content sales teams share.
Track:
Content opens: Whether buyers open shared assets.
Time spent: How long buyers engage with the content.
Repeat views: Whether buyers return to the same content.
Internal sharing: Whether buyers forward assets to other stakeholders.
Content by buying stage: Which assets help buyers move from interest to decision.
This KPI matters because seller usage alone is not enough. If reps love a deck but buyers ignore it, the content is not doing its job.
12. Tool Adoption
Tool adoption measures whether reps actually use the platforms meant to support selling.
Track:
CRM usage: Whether reps update opportunities, contacts, next steps, and deal notes.
Enablement platform usage: Whether reps use content hubs, playbooks, or training tools.
AI tool usage: Whether reps use AI tools for approved answers, research, drafting, or proposal support.
Search behavior: What reps search for and where they fail to find answers.
Workflow adoption: Whether tools are used inside the sales process or treated as extra work.
13. Training Retention
Training retention measures whether reps remember and apply what they learned after training.
Track:
Assessment scores: How well reps understand the material after training.
Behavior change: Whether reps apply the training in calls, demos, and follow-ups.
Manager observation: Whether managers see improved execution.
Certification completion: Whether reps complete required learning paths.
Post-training performance: Whether trained reps improve conversion, deal quality, or quota attainment
Pro tip: Do not stop at attendance. A rep can attend every training session and still fail to apply the message in a live buyer conversation.
14. Rep/User Satisfaction
Rep satisfaction shows whether enablement content, tools, and processes are actually useful to the people expected to use them.
Track:
Content helpfulness: Whether reps find sales content practical and current.
Tool experience: Whether platforms save time or create more admin.
Training relevance: Whether training matches real deal situations.
Search friction: Whether reps can quickly find the answers they need.
Feedback themes: Common complaints, requests, or bottlenecks from reps.
This KPI matters because low satisfaction usually shows up later as poor adoption. If reps do not trust the content or tools, they will work around them.
15. Enablement Cost Per Outcome
Enablement cost per outcome measures whether enablement spend is producing real business returns.
Track:
Cost per rep enabled: Enablement spend divided by the number of reps supported.
Cost per deal influenced: Enablement investment compared with closed-won deals supported by enablement.
Cost per hour saved: Spend compared with time saved through training, tools, automation, or process improvements.
Cost per productivity gain: Enablement cost compared with improvements in rep output, quota attainment, or pipeline created.
Cost per win-rate improvement: Spend compared with measurable lift in win rate or conversion performance.
16. Automation Rate
Automation rate measures how much repeatable sales enablement work is handled by systems instead of manual effort.
Track:
Content automation rate: How much content retrieval, recommendation, updating, or personalization is automated.
RFP and proposal automation rate: How much response drafting, answer retrieval, formatting, and review routing is automated.
Admin automation rate: How much CRM updating, reporting, task routing, or follow-up work is automated.
Knowledge access automation: How often reps can find approved answers without asking managers, SMEs, or enablement teams.
Capacity freed: Hours returned to reps, SMEs, managers, or proposal teams through automation.
For teams handling high volumes of RFPs, DDQs, and security questionnaires, automation rate shows whether manual response work is actually being reduced, not just moved into another tool.
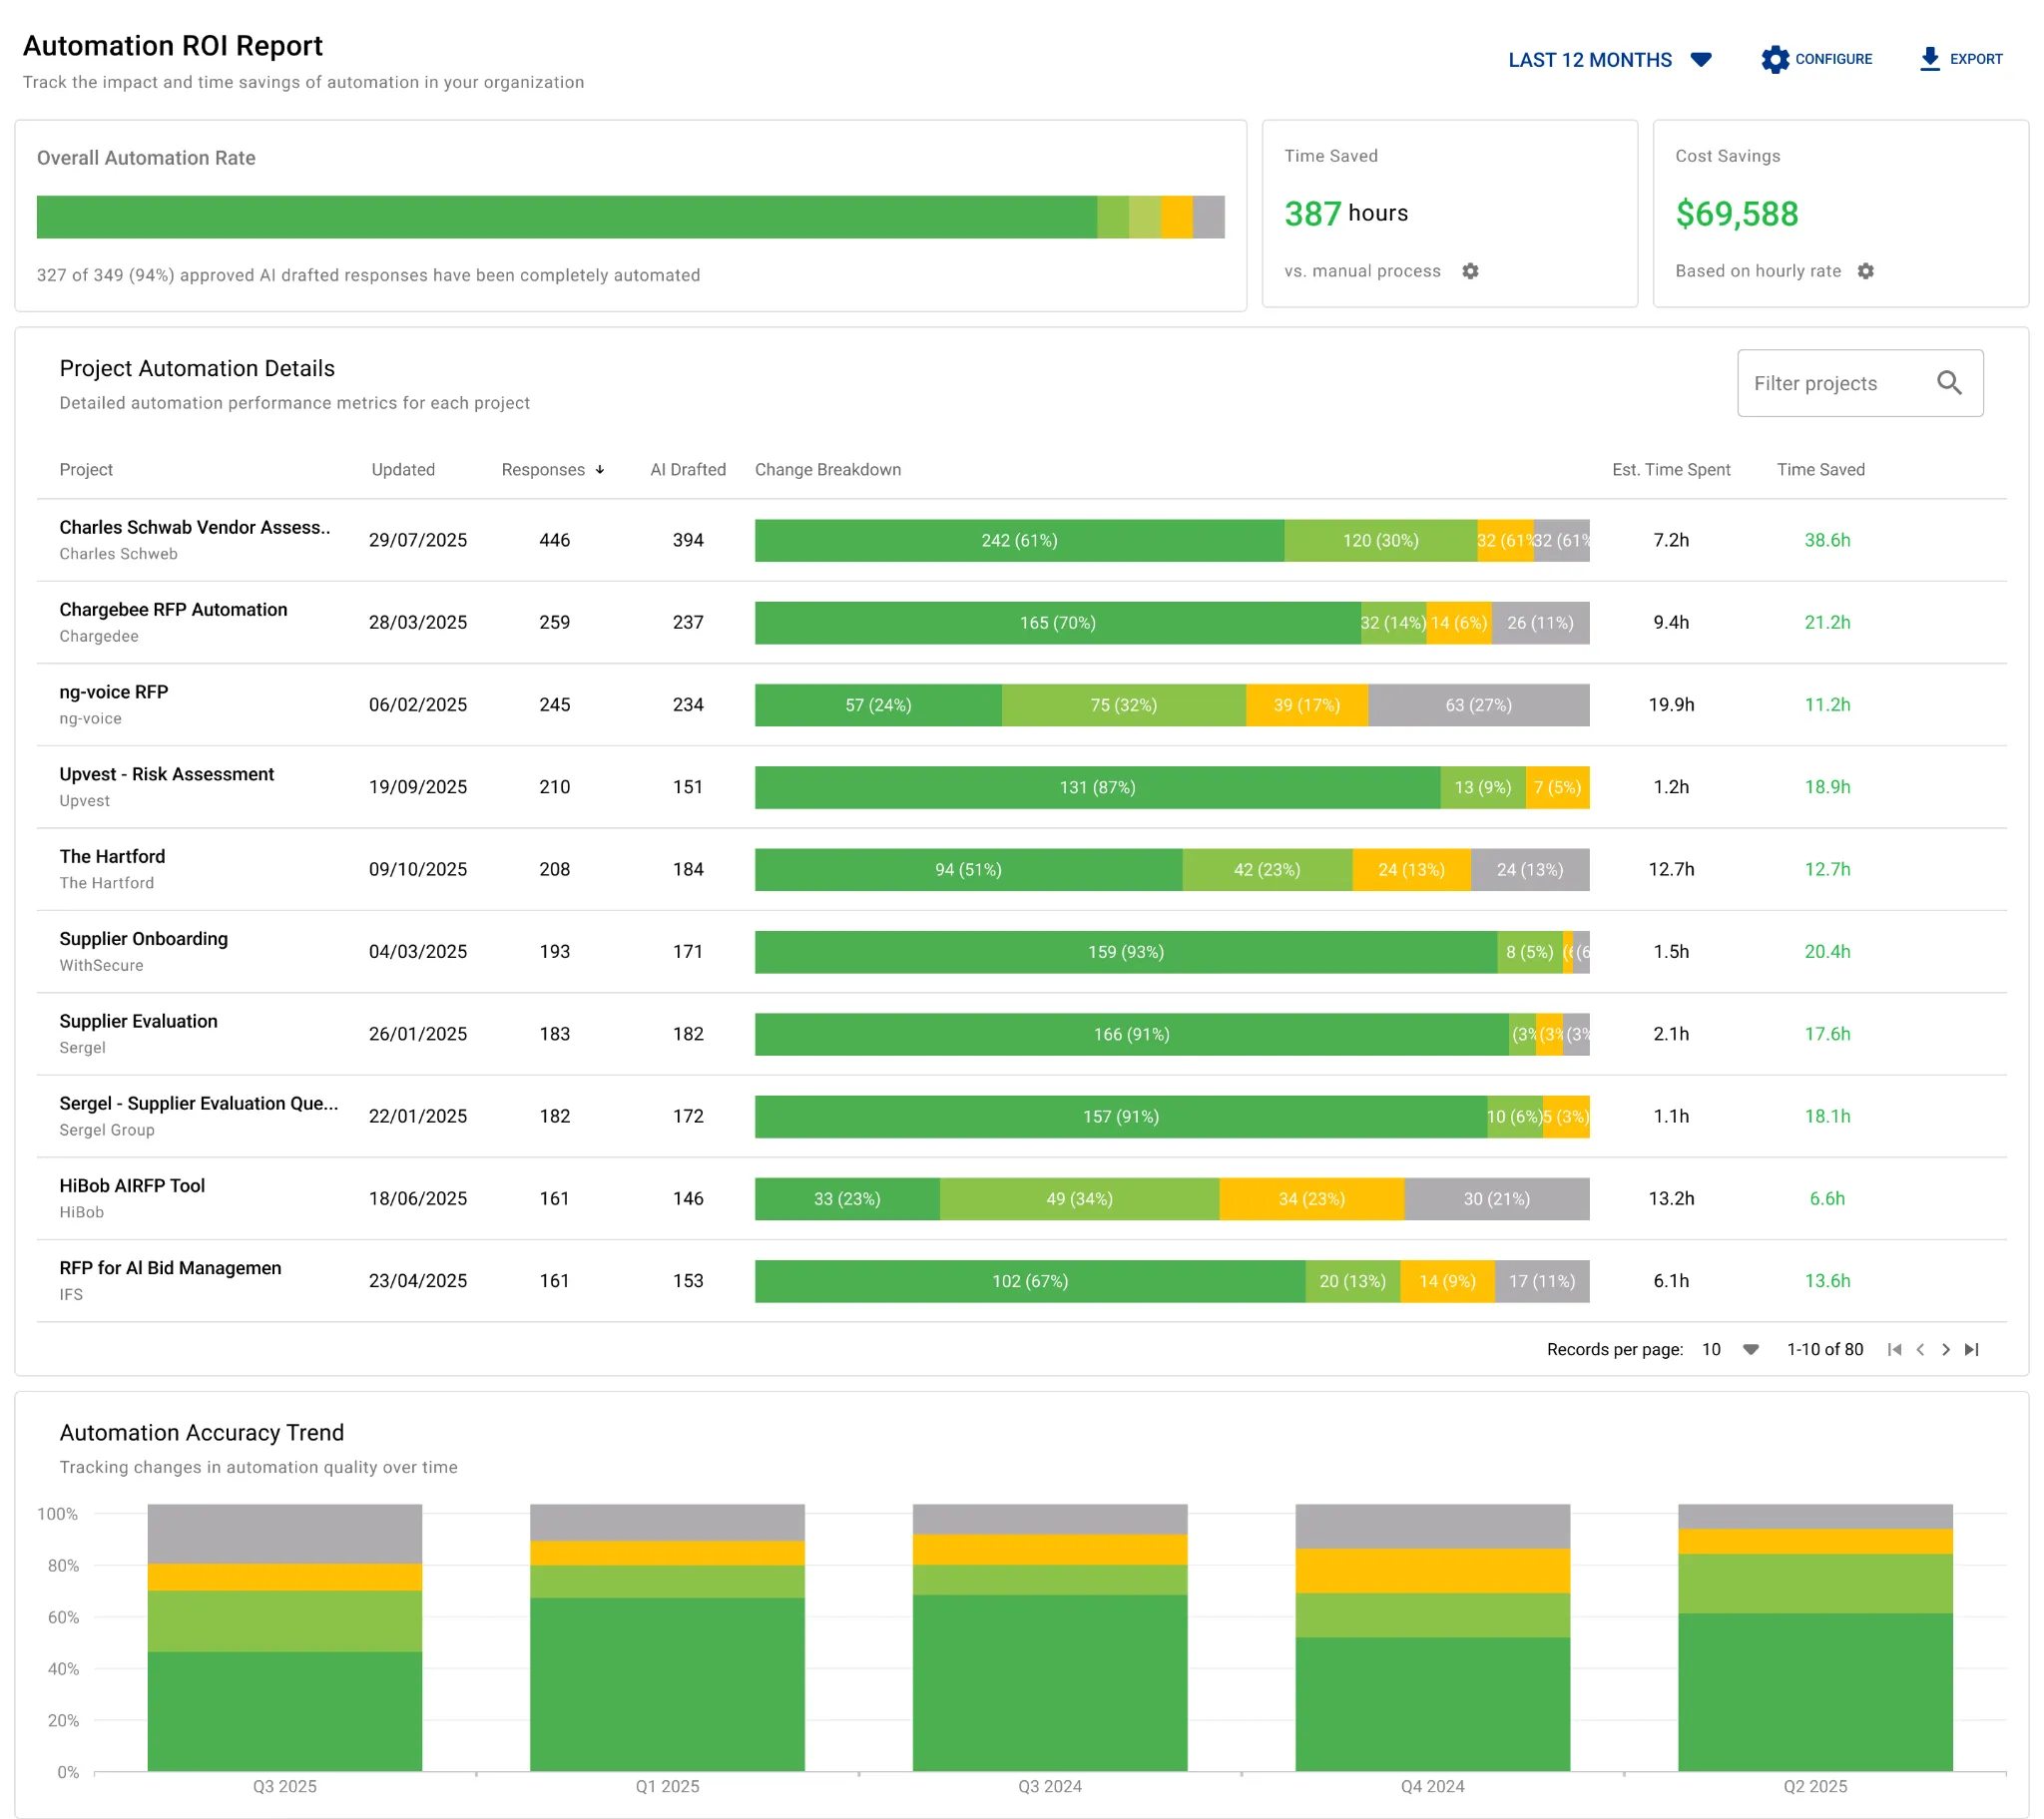
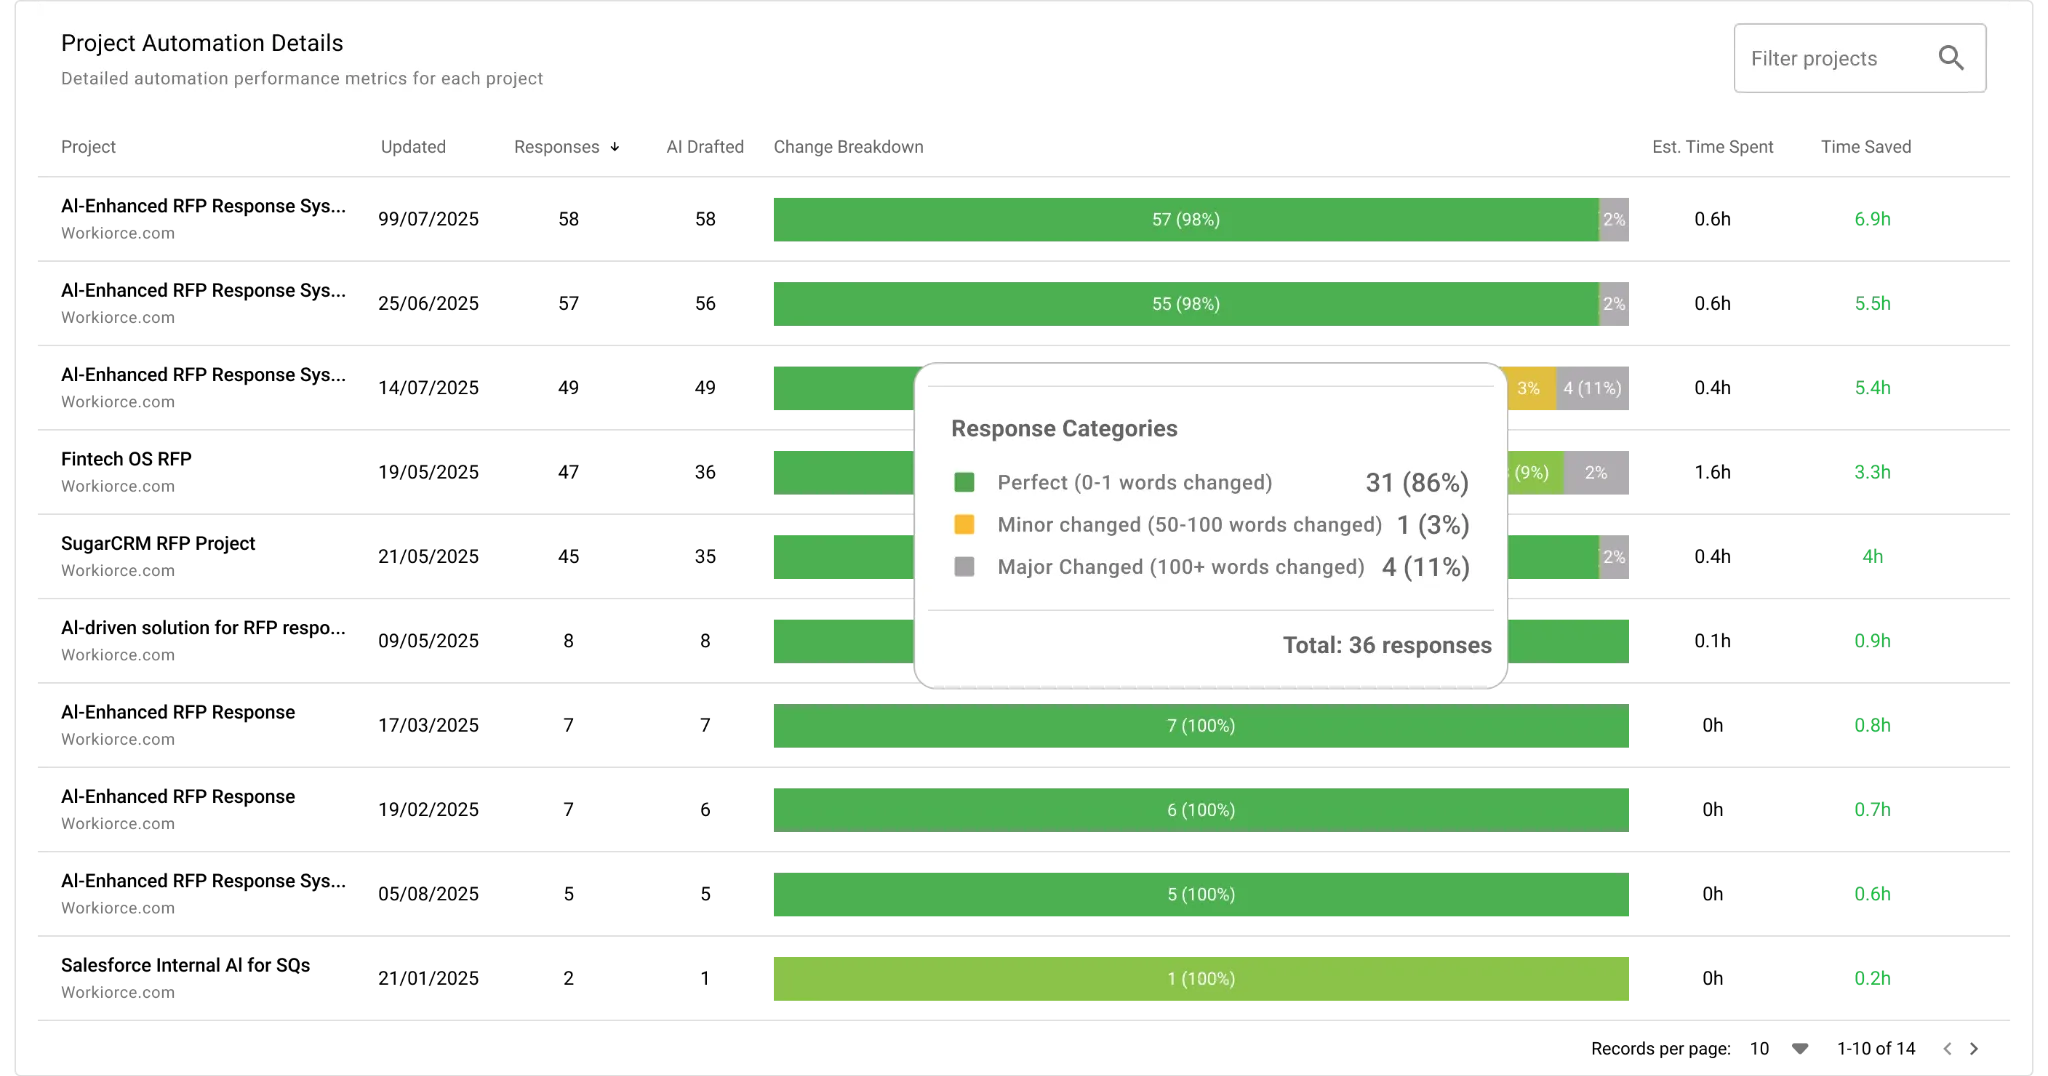
AutoRFP.ai helps prove that payoff with ROI reporting across automation rate, cost savings, team efficiency, capacity freed by person, response type breakdowns, and accuracy trends.
How Automation Improves Sales Enablement KPIs at Scale
This is how automation improves sales enablement KPIs by making content, knowledge, workflows, and reporting easier to use in high-volume sales environments.
1. Provides a Single Source of Truth for Sales Content
Reps can find the latest approved decks, one-pagers, snippets, and answers without searching across shared drives or old messages. This improves consistency and reduces delays in high-volume sales teams.
- KPIs improved: Content usage and influence, buyer content adoption, sales cycle length, rep productivity
2. Recommends Content Automatically
Deal stage, persona, industry, or CRM fields can trigger the right content automatically, so reps know what to send next without guessing.
- KPIs improved: Win rate, conversion rate, sales cycle length, buyer content adoption
3. Standardizes Messaging and Answers
Automation helps reps use approved messaging for product, pricing, competitor, security, and compliance questions. This reduces inconsistent answers across deals.
- KPIs improved: Win rate, deal quality, rep productivity, RFP win rate
4. Automates Repetitive Sales Tasks
Follow-ups, CRM logging, meeting scheduling, and reminders can be automated so reps spend less time on admin and more time selling.
- KPIs improved: Time spent selling, rep productivity, opportunities created / meetings set, quota attainment
5. Supports Onboarding and Coaching
New reps can receive role-based training, quizzes, coaching prompts, and manager alerts automatically, helping them ramp faster.
- KPIs improved: Time to productivity, training retention, quota attainment, rep / user satisfaction
6. Tracks Content Usage and Impact
Teams can track which assets reps use, which content buyers engage with, and which materials influence pipeline or closed-won revenue.
- KPIs improved: Revenue influenced, content usage and influence, buyer content adoption, enablement cost per outcome
7. Improves RFP Content Reuse
For RFPs, DDQs, security questionnaires, and tenders, tools like AutoRFP.ai help teams reuse approved answers from a current content library instead of starting from scratch.
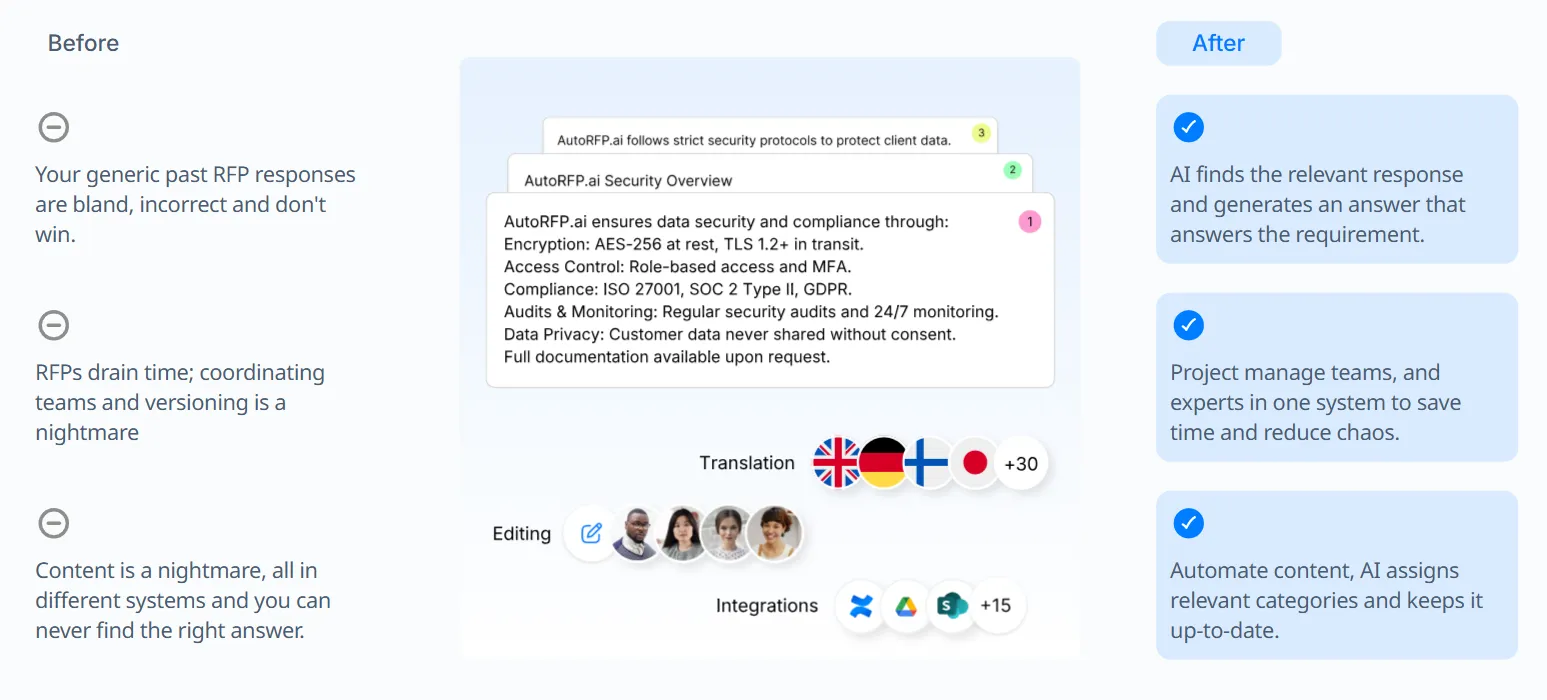
- KPIs improved: RFP response time, RFP win rate, rep productivity, SME turnaround time
8. Creates AI-Assisted First Drafts for RFPs
AutoRFP.ai can help generate on-brand first drafts using existing organizational knowledge, reducing manual drafting and repeated SME questions.
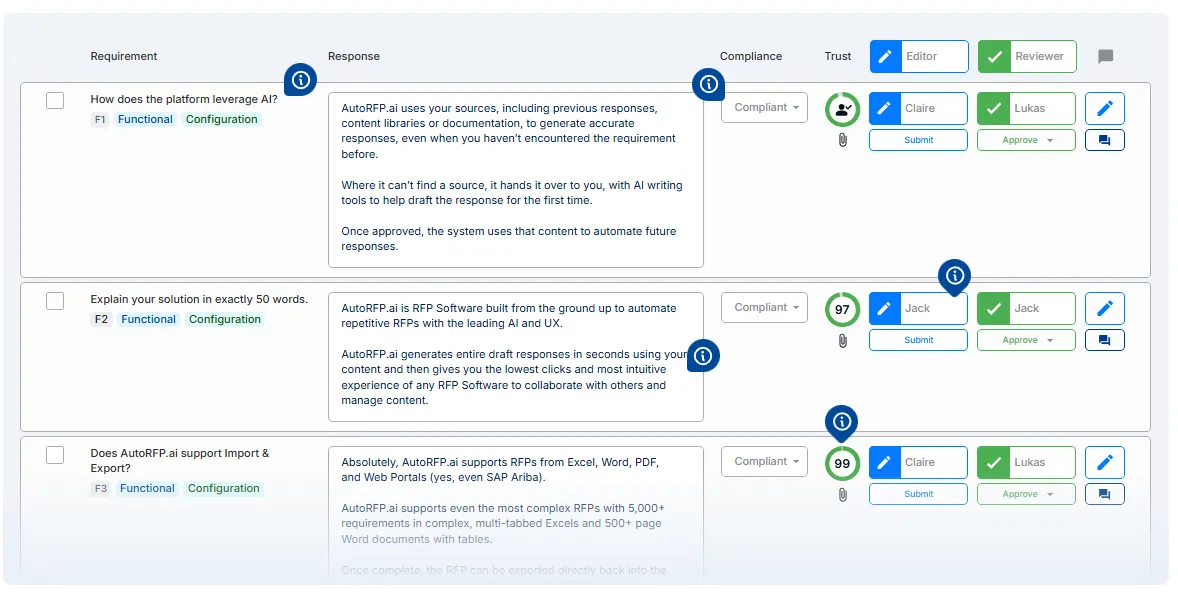
- KPIs improved: RFP response time, RFP win rate, time spent selling, enablement cost per outcome
9. Gives Reps Better Access to Expert Knowledge
Reps can access approved product, technical, security, or compliance knowledge faster, instead of waiting for SMEs every time.
- KPIs improved: Sales cycle length, rep satisfaction, deal quality, win rate
10. Connects Automation to Performance Analytics
Leaders can compare enablement cost against time saved, productivity gains, win-rate lift, revenue influenced, and faster ramp time.
- KPIs improved: Enablement cost per outcome, revenue influenced, quota attainment, productivity
Steps to Track, Measure, and Analyze Sales Enablement Success
Tracking sales enablement KPIs works best when every metric has a clear owner, source, business outcome and review rhythm. Otherwise, teams end up with more dashboards, but not better decisions. Here’s how to track:
| Step | What to do | Why it matters |
|---|---|---|
| Step 1: Define the business outcome first | Start with the result sales leadership cares about, such as higher win rate, shorter sales cycles, stronger quota attainment, faster ramp time, or better RFP win rate. | KPIs only matter when they connect to a real sales outcome. |
| Step 2: Choose KPIs that connect to revenue | Focus on KPIs that show pipeline, productivity, conversion, revenue influence, or time saved. | Buyers expect stronger business justification, so enablement needs to prove its impact on revenue outcomes. |
| Step 3: Separate activity metrics from performance KPIs | Treat training completion, content views, and number of RFPs submitted as metrics. Treat win rate, quota attainment, sales cycle length, and RFP win rate as KPIs. | Activity shows what happened. KPIs show whether it mattered. |
| Step 4: Set a baseline before making changes | Measure current performance before launching new training, content, automation, onboarding, or sales plays. | Without a baseline, you cannot prove whether enablement improved the result. |
| Step 5: Define the data source for each KPI | Decide where each number comes from, such as CRM, sales enablement software, LMS, call intelligence, proposal software, or content analytics. | Clean data prevents KPI reviews from turning into debates about which number is correct. |
| Step 6: Assign ownership | Give each KPI a clear owner. Sales ops may own CRM data, enablement may own content and training data, and proposal teams may own RFP performance. | KPIs improve only when someone is responsible for tracking, explaining, and acting on them. |
| Step 7: Review leading and lagging indicators together | Track early signals like tool adoption, content usage, and training retention alongside outcomes like revenue, win rate, and quota attainment. | Leading indicators show what may happen next. Lagging indicators show what already happened. |
| Step 8: Break results down by team and segment | Analyze KPIs by rep tenure, region, product, deal size, industry, sales motion, or manager. | Averages can hide the real problem. One team may be improving while another is stuck. |
| Step 9: Connect KPI movement to enablement actions | When a KPI changes, check what changed around it: content, training, messaging, onboarding, automation, or proposal support. | This helps teams understand what actually caused the improvement or decline. |
| Step 10: Remove KPIs that do not guide decisions | Cut metrics that nobody uses to change behavior, improve programs, or prioritize resources. | More dashboards do not create better decisions. Better KPI selection does. |
| Step 11: Automate where manual work slows the team down | Look for repeatable work that takes reps away from selling, such as answer retrieval, proposal drafting, RFP responses, CRM updates, or reporting. | Automation should be measured by whether it gives time back and improves sales execution. |
| Step 12: Report insights, not just numbers | Explain what changed, why it changed, what the team will do next, and who owns the follow-up. | The goal is not a prettier dashboard. The goal is better sales performance. |
Case Studies & Examples on Improving Sales Enablement KPIs
Let’s look at a few case studies and examples that show how sales enablement KPIs improve when teams fix the real bottlenecks: content access, rep readiness, sales cycle friction, response speed and automation.
1. Allianz Trade Improved Quota Attainment and Win Rate
Allianz Trade shows how a single source of truth for sales content can improve adoption, quota attainment and win rate.
Scenario: Allianz Trade needed to equip sellers with accurate, up-to-date sales materials in a specialized financial services market.
Challenge: Reps had version-control issues, outdated content and limited access to the right resources, which made consistent selling harder.
Solution: The team launched a dedicated enablement platform and built a stronger enablement function around content access, onboarding and analytics.
Result: Allianz Trade reported 98% platform adoption, a 20% increase in quota attainment, 15 hours saved per rep per week and a 10% improvement in win rate.
2. Andela Shortened Sales Cycle Time
Andela shows how sales conversation insights can help enablement teams tighten messaging and reduce sales cycle length.
Scenario: Andela wanted to improve how sellers positioned value during buyer conversations.
Challenge: The company already had conversation intelligence data, but enablement needed to turn that data into better coaching and stronger sales execution.
Solution: The enablement team used Gong insights to study sales conversations, identify what worked and align the team around a sharper pitch.
Result: Andela shortened sales cycle times by 33%, making sales cycle length the clearest KPI improvement from the initiative.
3. Microsoft Improved Seller Productivity With AI Content Recommendations
Microsoft’s MSX Sales Copilot example shows how better knowledge access can improve rep productivity and content usage.
Scenario: Microsoft sellers needed fast access to relevant sales materials during customer conversations.
Challenge: Large content repositories make it hard for sellers to find the right material quickly, especially when they need it live on a call.
Solution: Microsoft built a real-time question-answering and content recommendation system using embeddings, re-ranking and a Copilot interface inside Dynamics CRM.
Result: The system returns relevant content recommendations in seconds and is deployed in the production version of MSX, Microsoft’s CRM used daily by sellers.
4. Workforce.com Doubled RFP Participation Rate With AutoRFP.ai
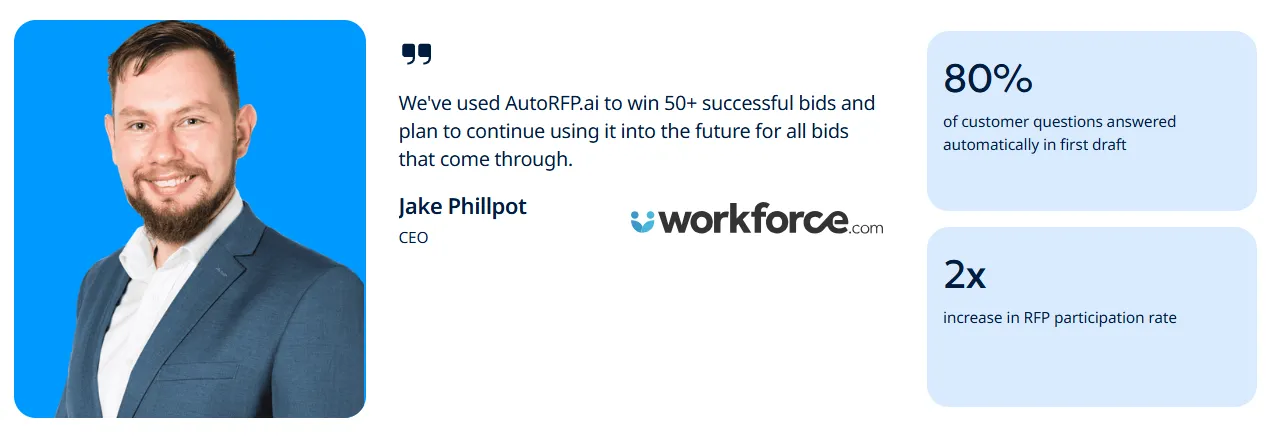
Workforce.com is relevant here because RFP participation rate, automation rate and first-draft answer coverage are sales enablement KPIs for teams that sell through RFPs.
Scenario: Workforce.com needed to respond to more complex, multi-product RFPs while expanding globally.
Challenge: The team was spending too much time on repetitive response creation, product-specific answer management and multilingual RFP work.
Solution: Workforce.com implemented AutoRFP.ai to automate RFP response drafts, organize product-specific content and support responses in more than 50 languages.
Result: Workforce.com reported 80% of customer questions answered automatically in the first draft, a 2x increase in RFP participation rate and 50+ successful bids won with AutoRFP.ai.
Jake Phillpot, CEO of Workforce.com said, “I’m really impressed that when we go and bid with AutoRFP.ai, in most cases 80% of the questions the customers have are answered with the first instance.”
Optimize Your Sales Enablement Strategy With AutoRFP.ai
Sales enablement should help reps move faster, not add more admin. When your team handles RFPs, DDQs, and security questionnaires, the biggest bottleneck is often finding the right approved answer, proving where it came from, and keeping responses consistent across every deal.
AutoRFP.ai helps sales and proposal teams standardize answers, create source-backed first drafts, track automation rate, and measure ROI across cost savings, team efficiency, capacity freed, and response quality.
Book a demo to see how AutoRFP.ai can improve your sales enablement KPIs.
FAQs
1. What Is a Sales Enablement KPI Benchmark?
A sales enablement KPI benchmark is the target or comparison point used to judge performance. It can be based on past performance, team goals, industry averages, rep cohorts, or specific business targets like win rate, quota attainment, ramp time, or sales cycle length.
The key is to use benchmarks that match your sales motion. A benchmark for an enterprise RFP-heavy team will look different from a high-volume outbound team.
2. How Often Should Sales Enablement KPIs Be Reviewed?
Sales enablement KPIs should usually be reviewed monthly, with deeper quarterly reviews.
Monthly reviews help teams catch issues early, such as low content usage, poor tool adoption, or longer sales cycles. Quarterly reviews are better for bigger decisions, such as whether enablement programs are improving revenue, quota attainment, ramp time, or win rate.
3. Who Is Responsible for Tracking Sales Enablement KPIs?
Sales enablement usually owns the KPI strategy, but the data often comes from multiple teams.
Revenue operations or sales operations may own CRM and pipeline data. Sales managers may own rep performance and behavior feedback. Enablement teams usually own content, training, onboarding, and tool adoption data. For RFP-heavy teams, proposal or bid teams may also track RFP win rate, response time, automation rate, and completed-on-time rate.
4. How Long Does It Take to See Results From Sales Enablement Initiatives?
It depends on the KPI. Some changes show up quickly, such as tool adoption, content usage, training completion, or time saved through automation. Revenue KPIs usually take longer because win rate, quota attainment, sales cycle length, and revenue influence need enough deal data to show a reliable trend. A practical timeline is 30 to 60 days for adoption signals, and one to two full sales cycles for revenue impact.
5. How Can AutoRFP.ai Help Sales Enablement Teams?
AutoRFP.ai helps sales and proposal teams bring consistency, speed, and accuracy to the RFP side of the stack, so deals do not slow down when buyer requests get complex.
For teams handling RFPs, DDQs, and security questionnaires, it helps create source-backed first drafts, standardize approved answers, reduce repetitive response work, and track ROI through automation rate, cost savings, team efficiency, capacity freed, response type breakdowns, and accuracy trends.
About the author

Ops Lead
Ops Lead at AutoRFP.ai. Designs the pipeline, content, and handoff systems bid teams use to run RFPs end-to-end, and co-hosts live sessions on winning workflows.
LinkedInFrequently asked questions
What Is a Sales Enablement KPI Benchmark?
A sales enablement KPI benchmark is the target or comparison point used to judge performance. It can be based on past performance, team goals, industry averages, rep cohorts, or specific business targets like win rate, quota attainment, ramp time, or sales cycle length. The key is to use benchmarks that match your sales motion. A benchmark for an enterprise RFP-heavy team will look different from a high-volume outbound team.
How Often Should Sales Enablement KPIs Be Reviewed?
Sales enablement KPIs should usually be reviewed monthly, with deeper quarterly reviews. Monthly reviews help teams catch issues early, such as low content usage, poor tool adoption, or longer sales cycles. Quarterly reviews are better for bigger decisions, such as whether enablement programs are improving revenue, quota attainment, ramp time, or win rate.
Who Is Responsible for Tracking Sales Enablement KPIs?
Sales enablement usually owns the KPI strategy, but the data often comes from multiple teams. Revenue operations or sales operations may own CRM and pipeline data. Sales managers may own rep performance and behavior feedback. Enablement teams usually own content, training, onboarding, and tool adoption data. For RFP-heavy teams, proposal or bid teams may also track RFP win rate, response time, automation rate, and completed-on-time rate.
How Long Does It Take to See Results From Sales Enablement Initiatives?
It depends on the KPI. Some changes show up quickly, such as tool adoption, content usage, training completion, or time saved through automation. Revenue KPIs usually take longer because win rate, quota attainment, sales cycle length, and revenue influence need enough deal data to show a reliable trend. A practical timeline is 30 to 60 days for adoption signals, and one to two full sales cycles for revenue impact.
How Can AutoRFP.ai Help Sales Enablement Teams?
AutoRFP.ai helps sales and proposal teams bring consistency, speed, and accuracy to the RFP side of the stack, so deals do not slow down when buyer requests get complex. For teams handling RFPs, DDQs, and security questionnaires, it helps create source-backed first drafts, standardize approved answers, reduce repetitive response work, and track ROI through automation rate, cost savings, team efficiency, capacity freed, response type breakdowns, and accuracy trends.
